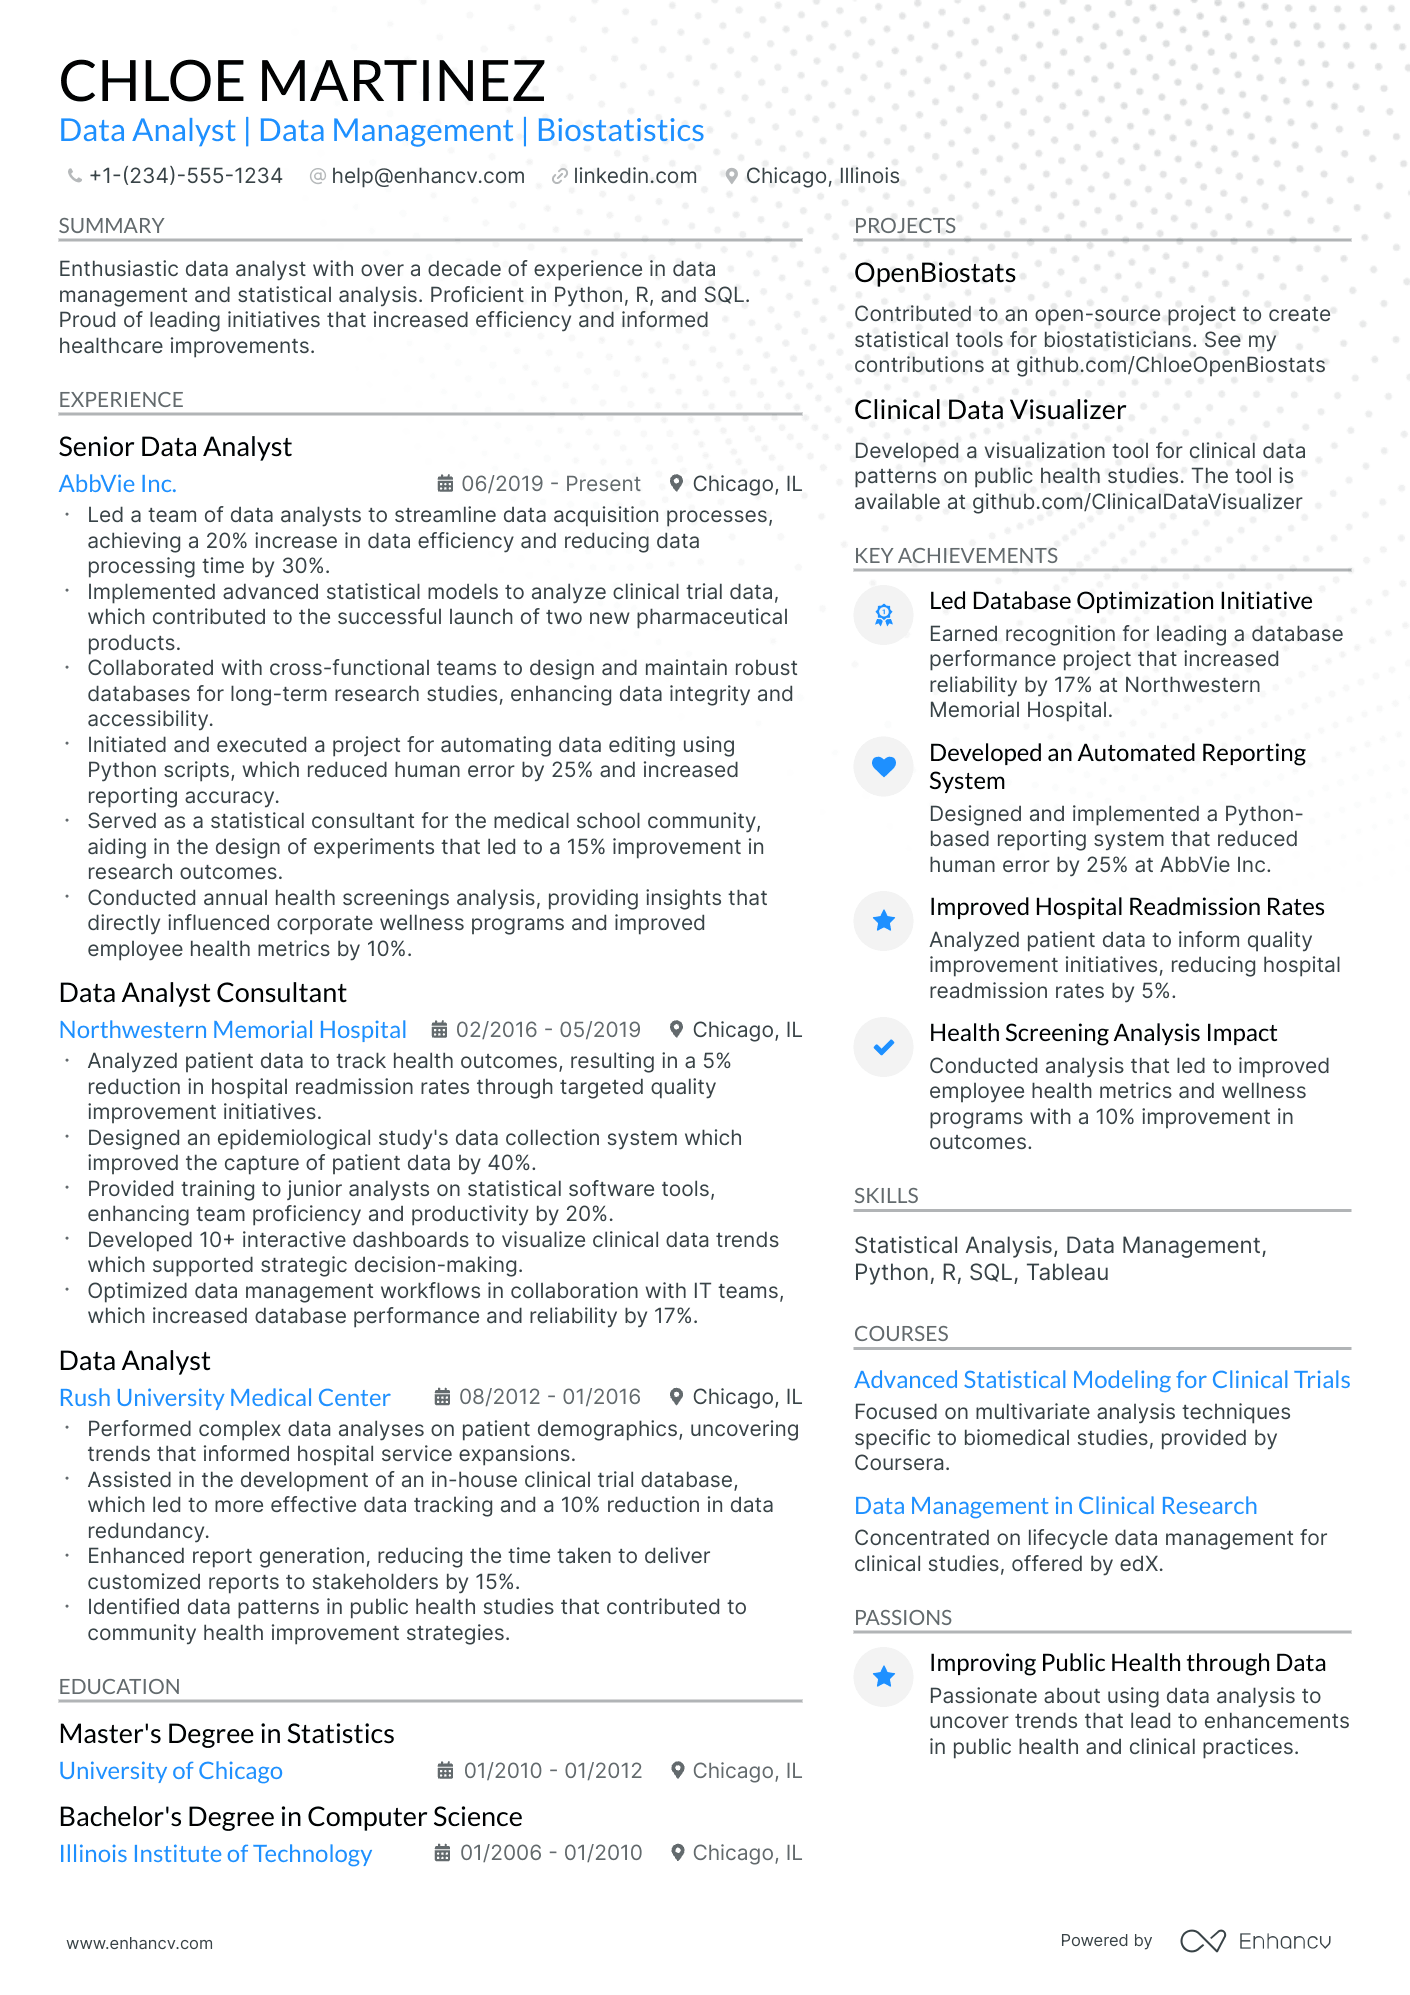
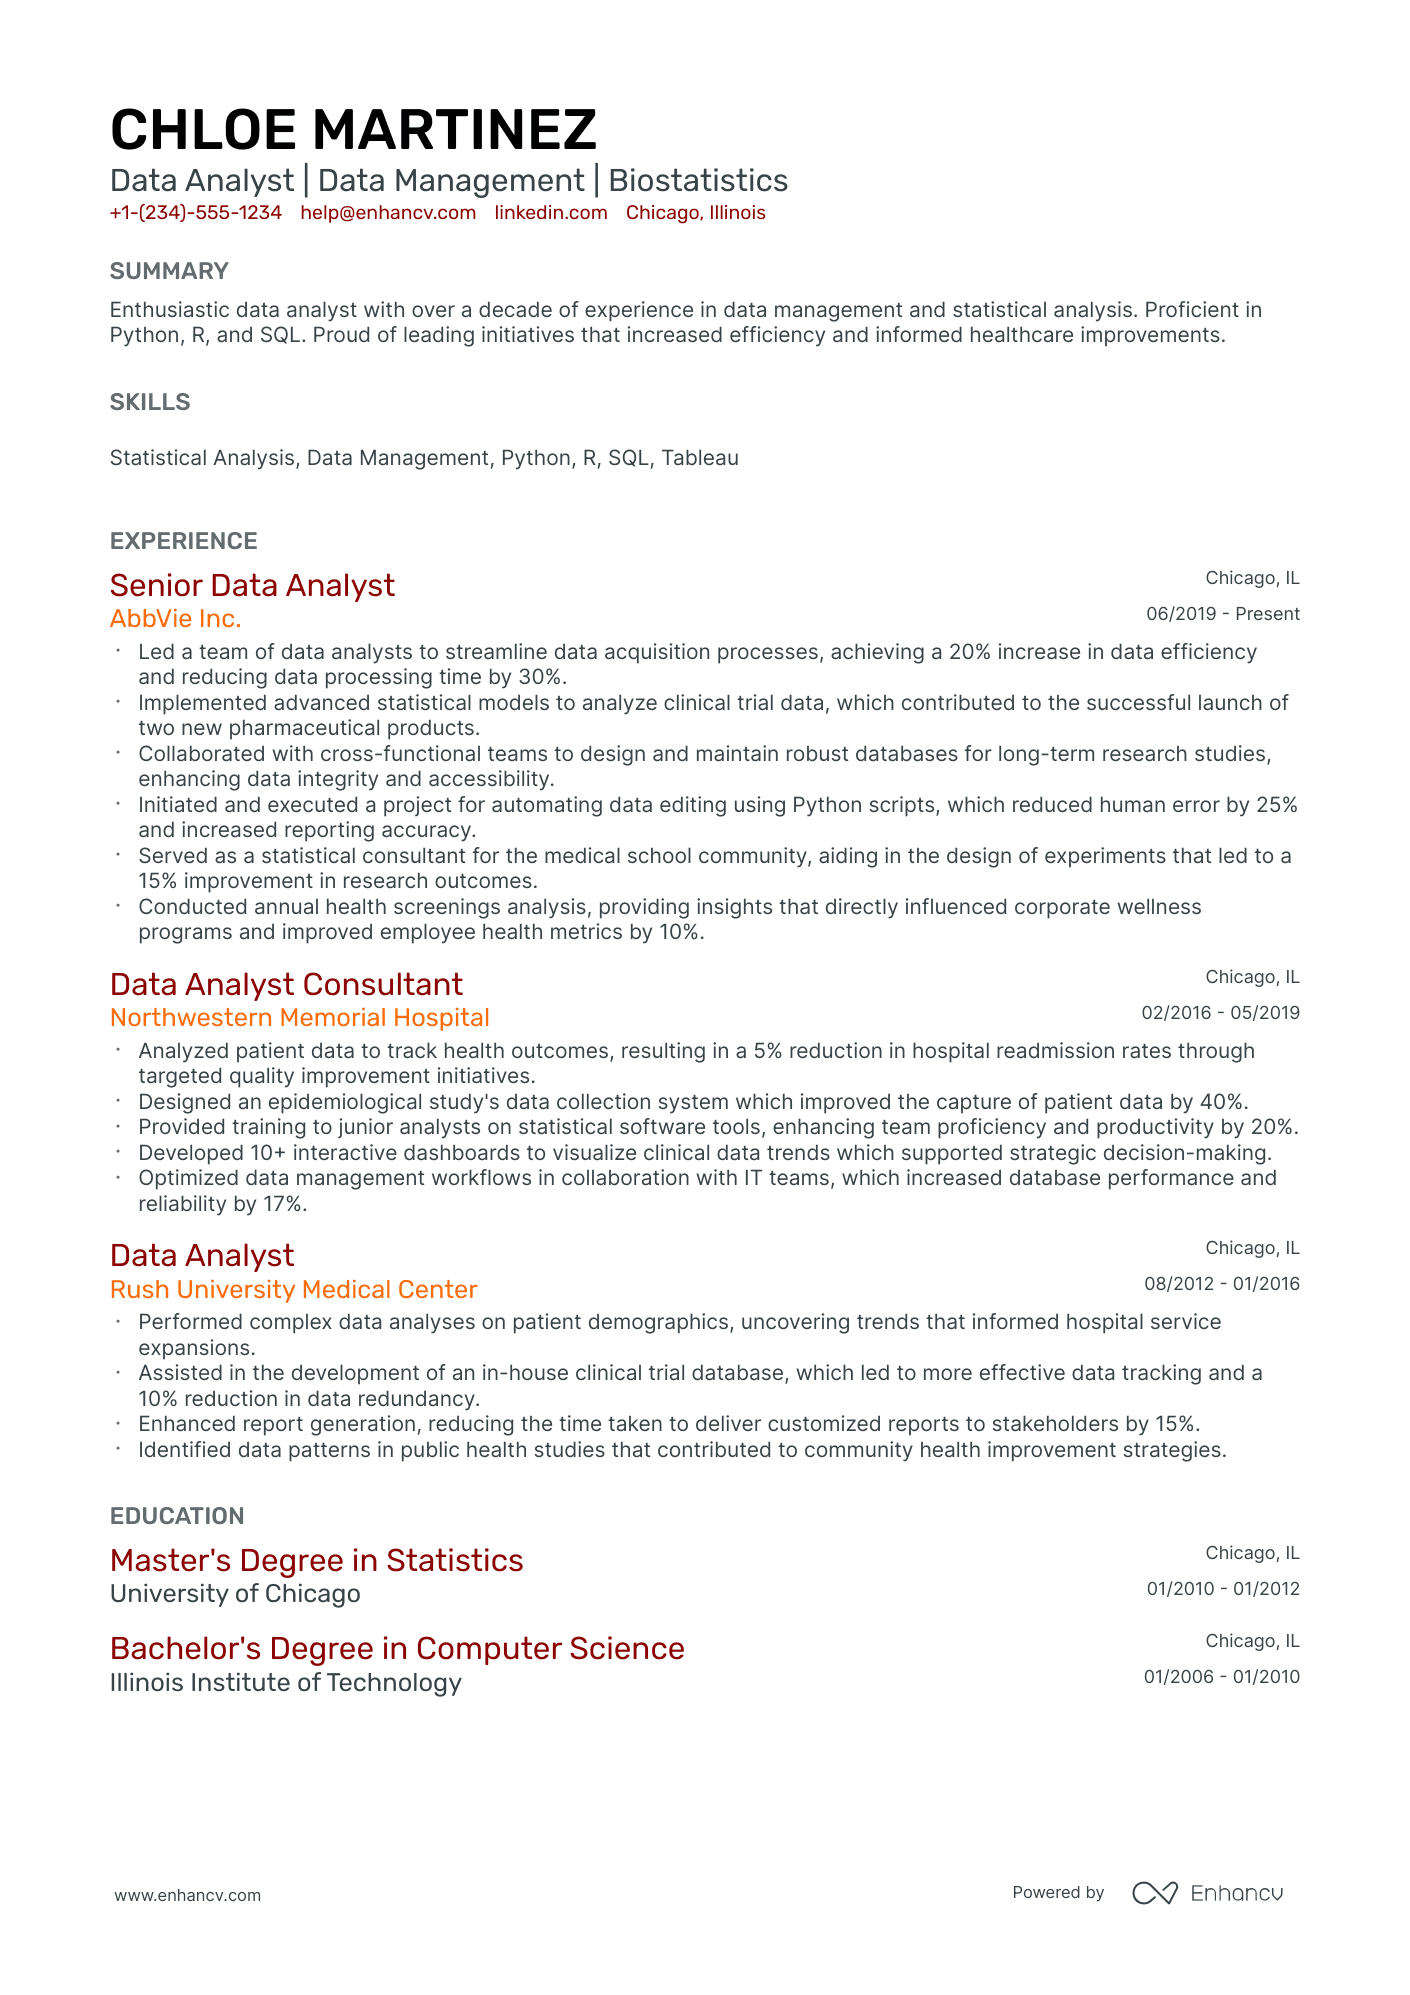
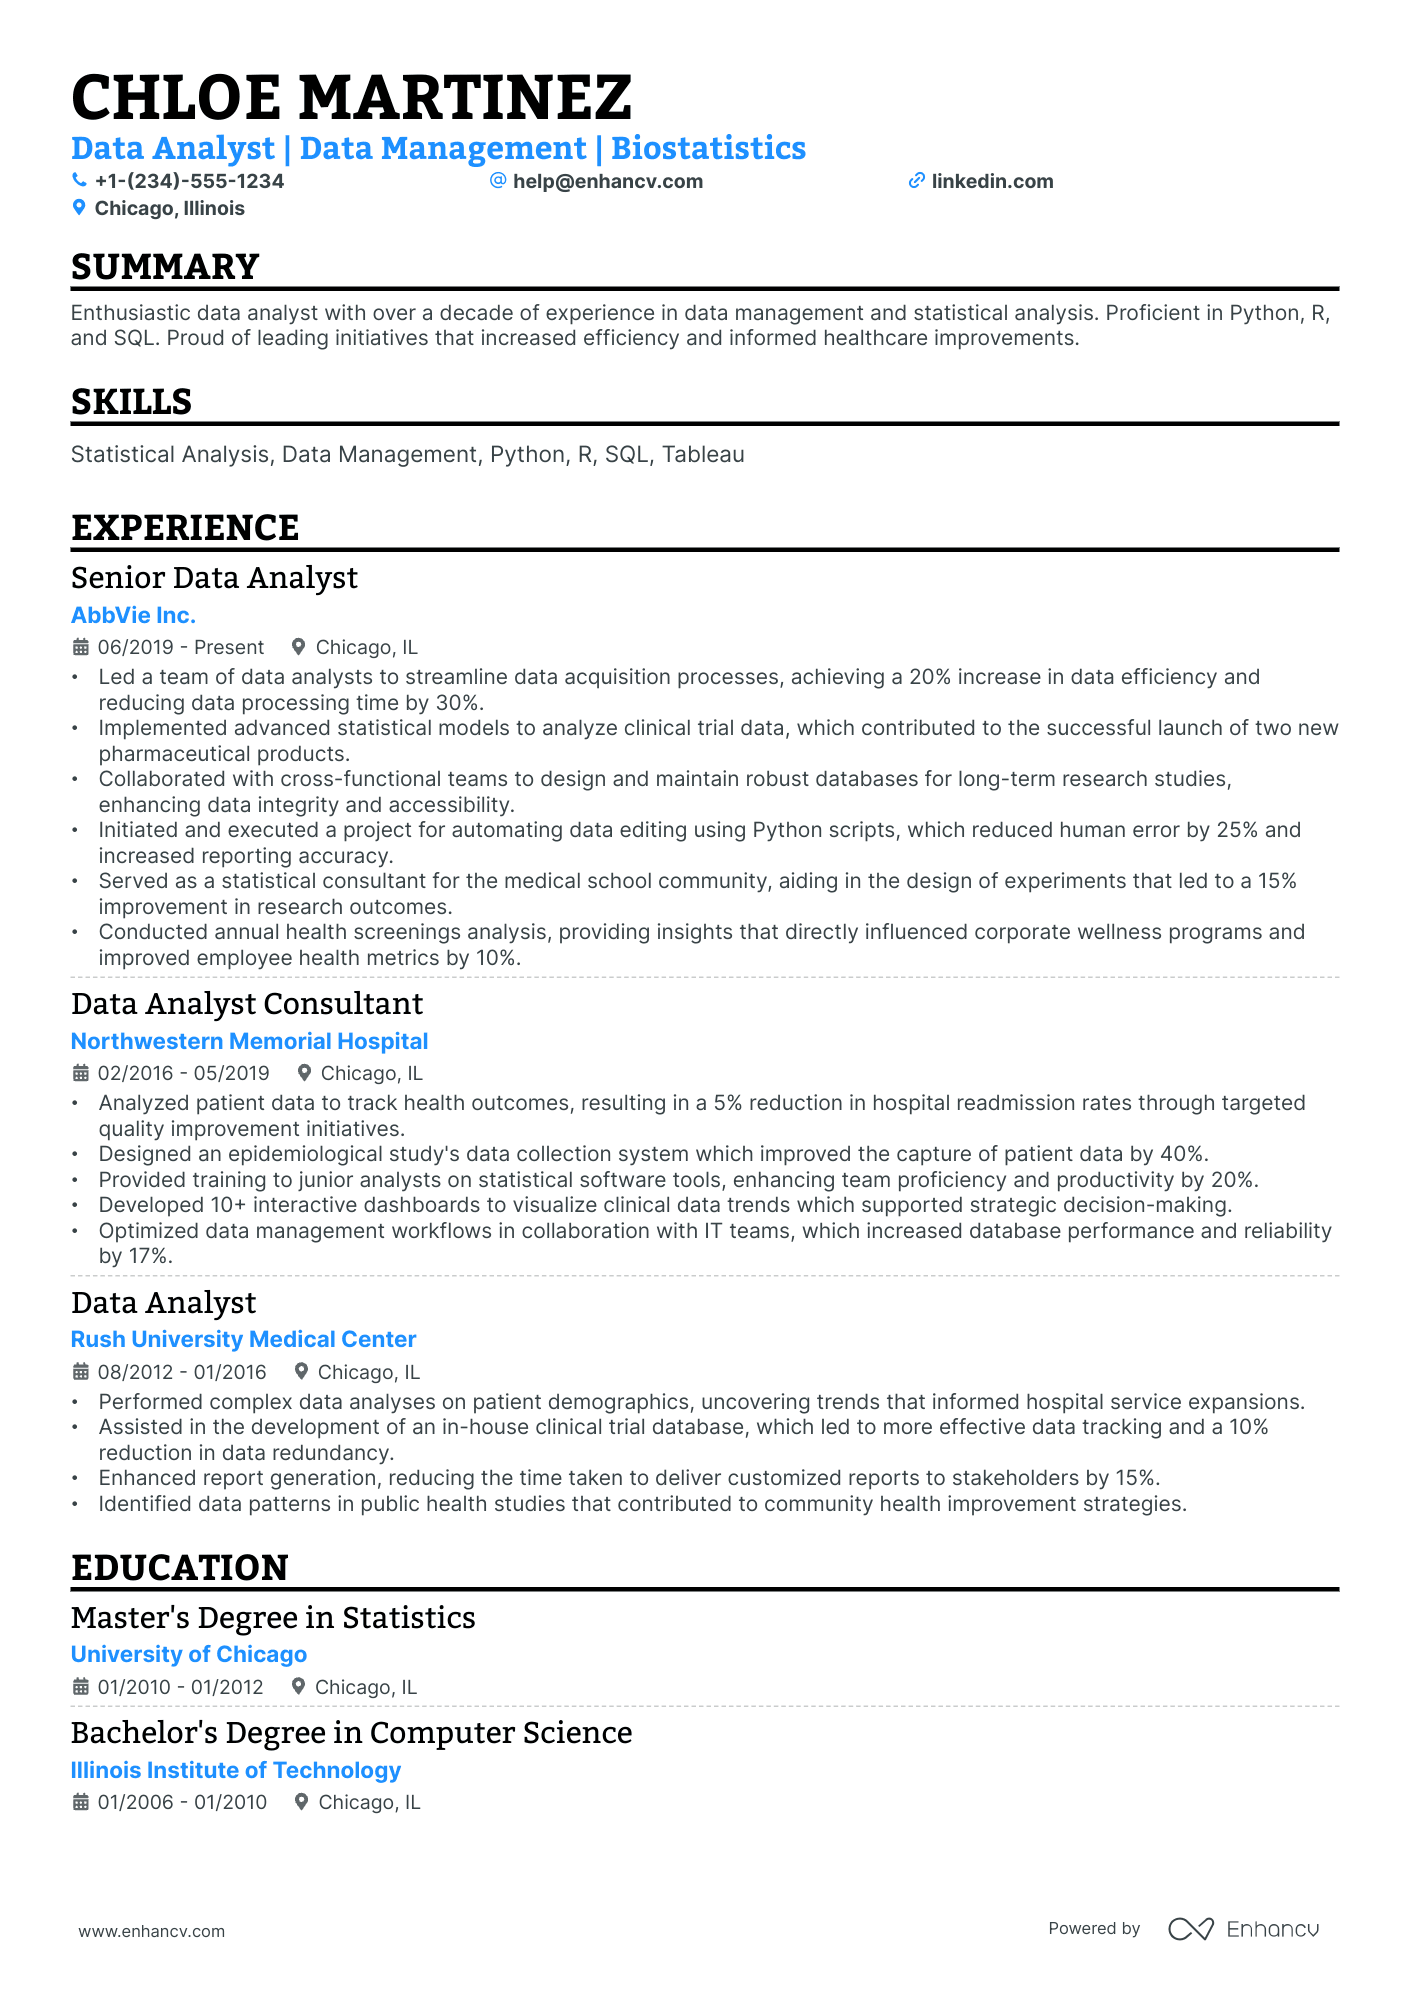
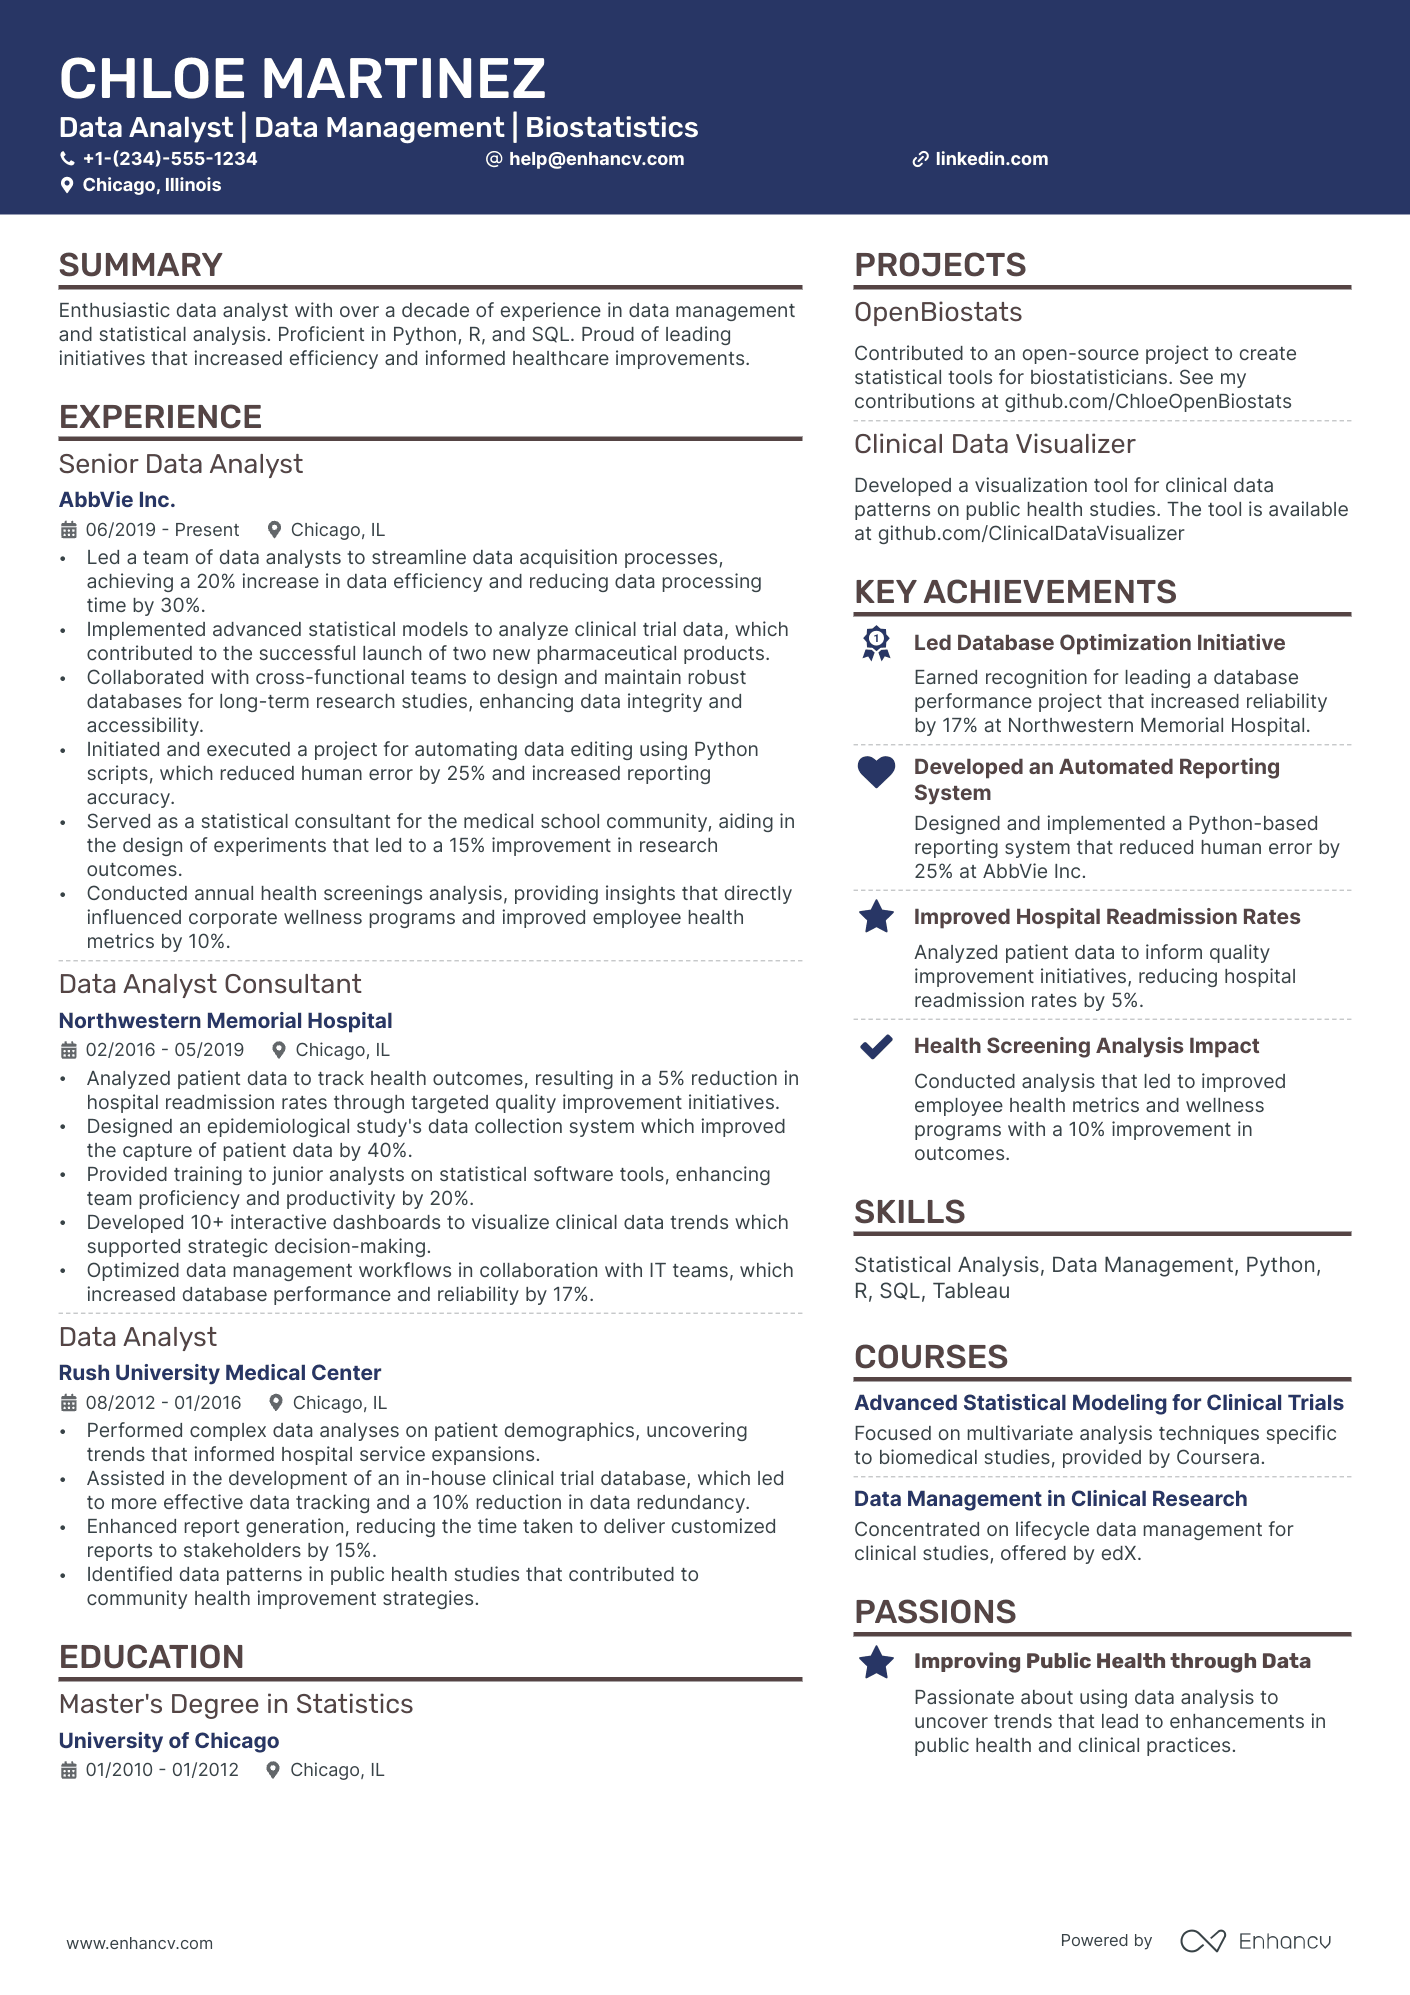
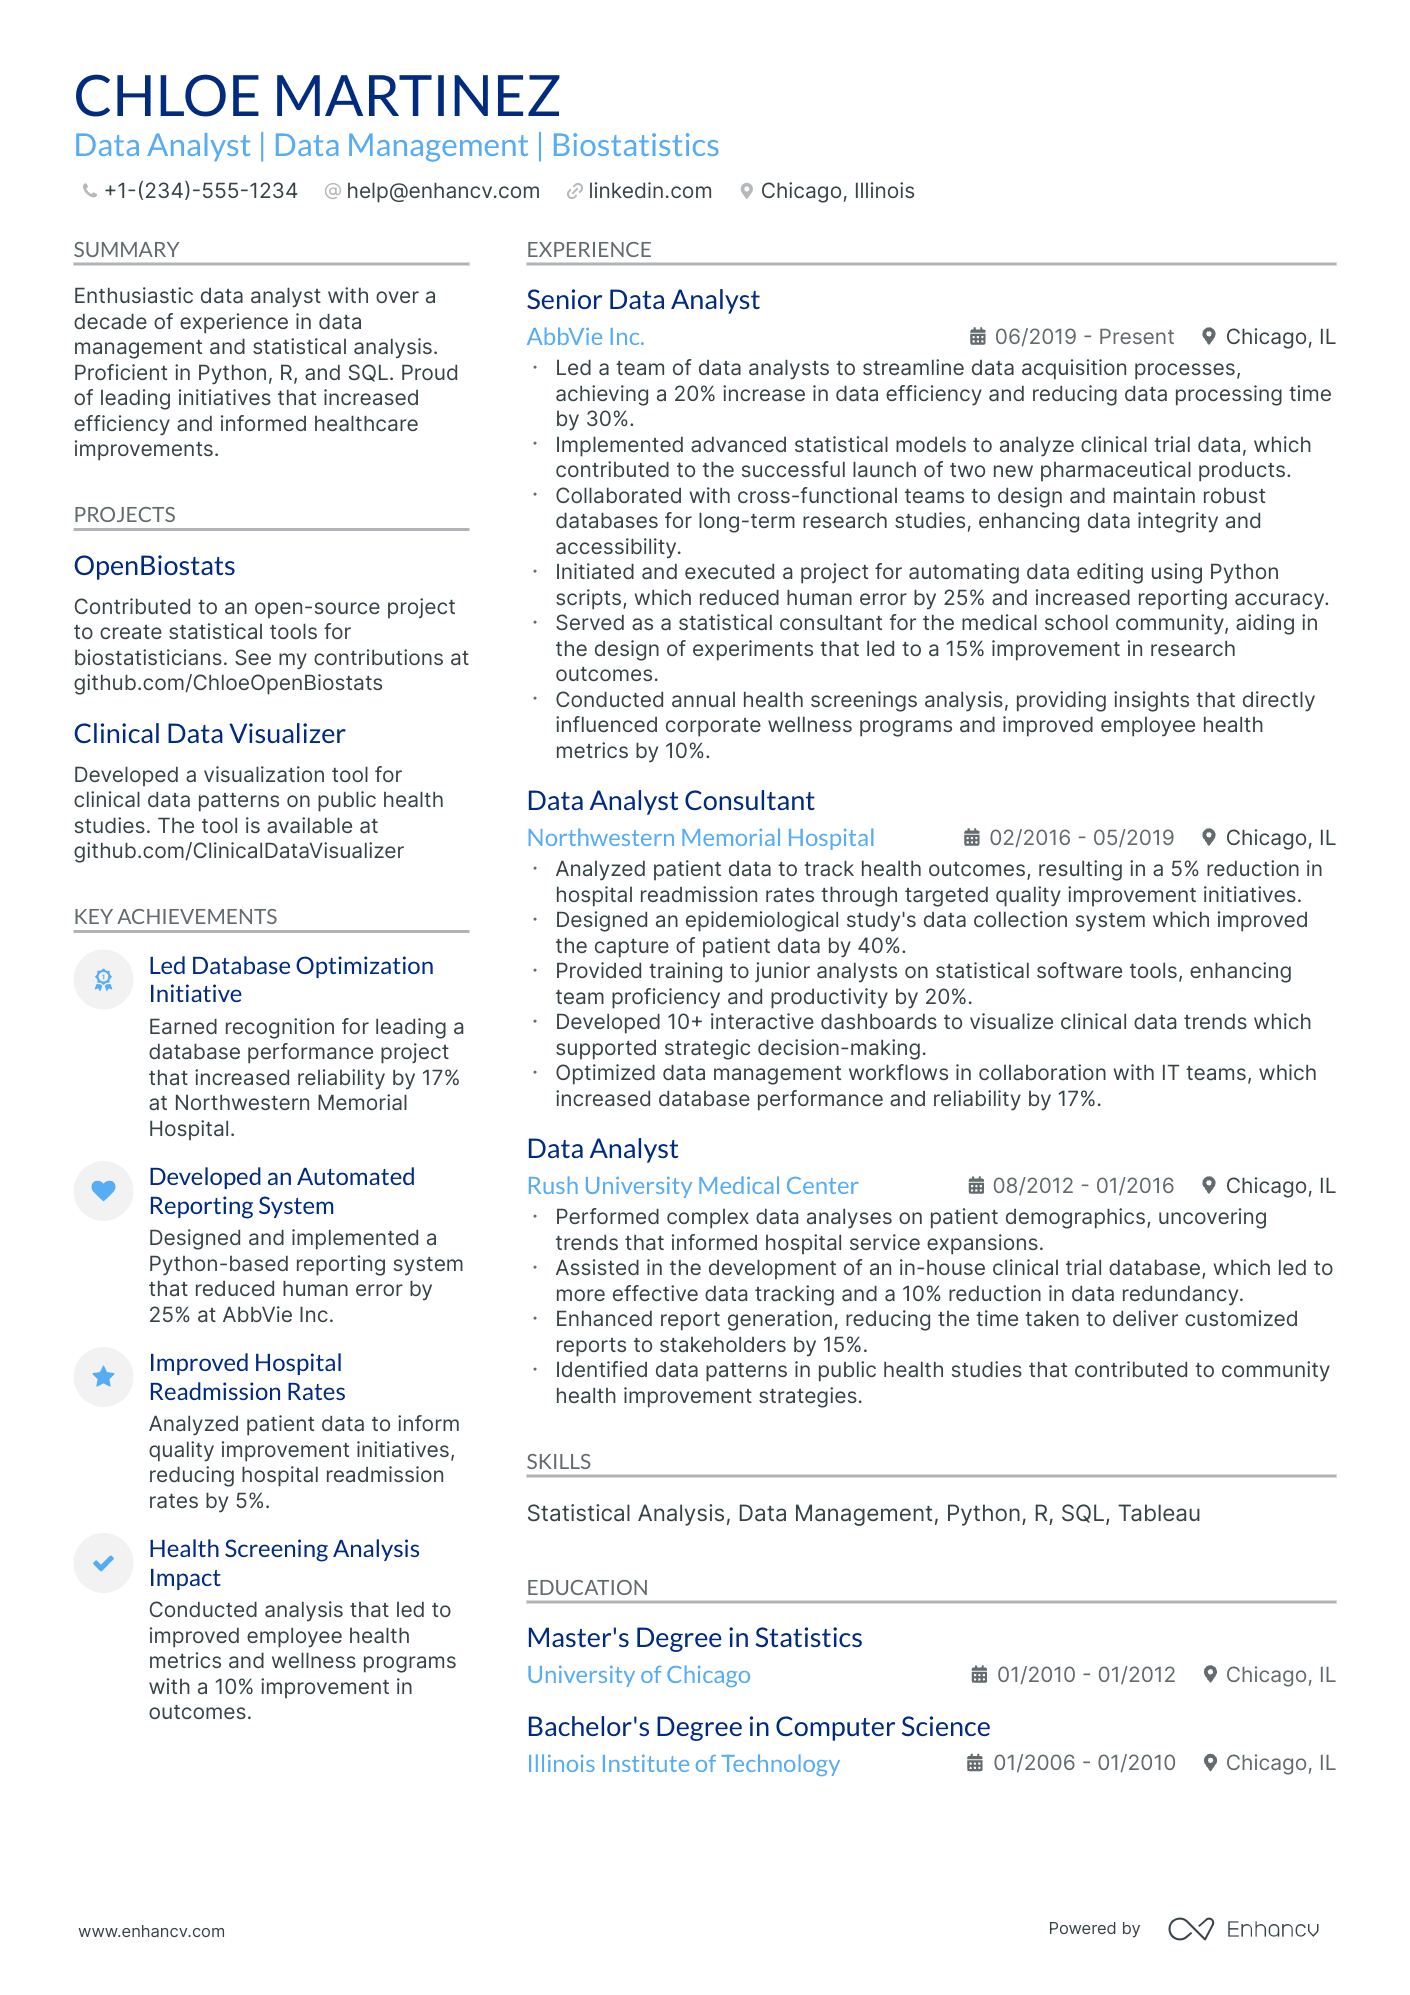
As a statistical data analyst, articulating the complexity of your data manipulation skills on a resume is a daunting challenge. Our guide will provide you with industry-specific examples that demonstrate how to effectively showcase your analytical prowess and quantitative achievements in a clear and impactful way.
- Statistical data analyst resume samples that got people hired at top companies.
- How to perfect the look-and-feel of your resume layout.
- How to showcase your achievements and skills through various resume sections.
- How you could hint to recruiters why your resume is the ideal profile for the job.
If the statistical data analyst resume isn't the right one for you, take a look at other related guides we have:
- Database Engineer Resume Example
- Data Specialist Resume Example
- Data Warehouse Engineer Resume Example
- Excel Data Analyst Resume Example
- Data Entry Clerk Resume Example
- Data Entry Analyst Resume Example
- GCP Data Engineer Resume Example
- Python Data Scientist Resume Example
- Data Management Analyst Resume Example
- Oracle Database Administrator Resume Example
Optimize your statistical data analyst resume format to pass the recruiters' assessment
You may be wondering just how much time you need to spend on designing your statistical data analyst resume.
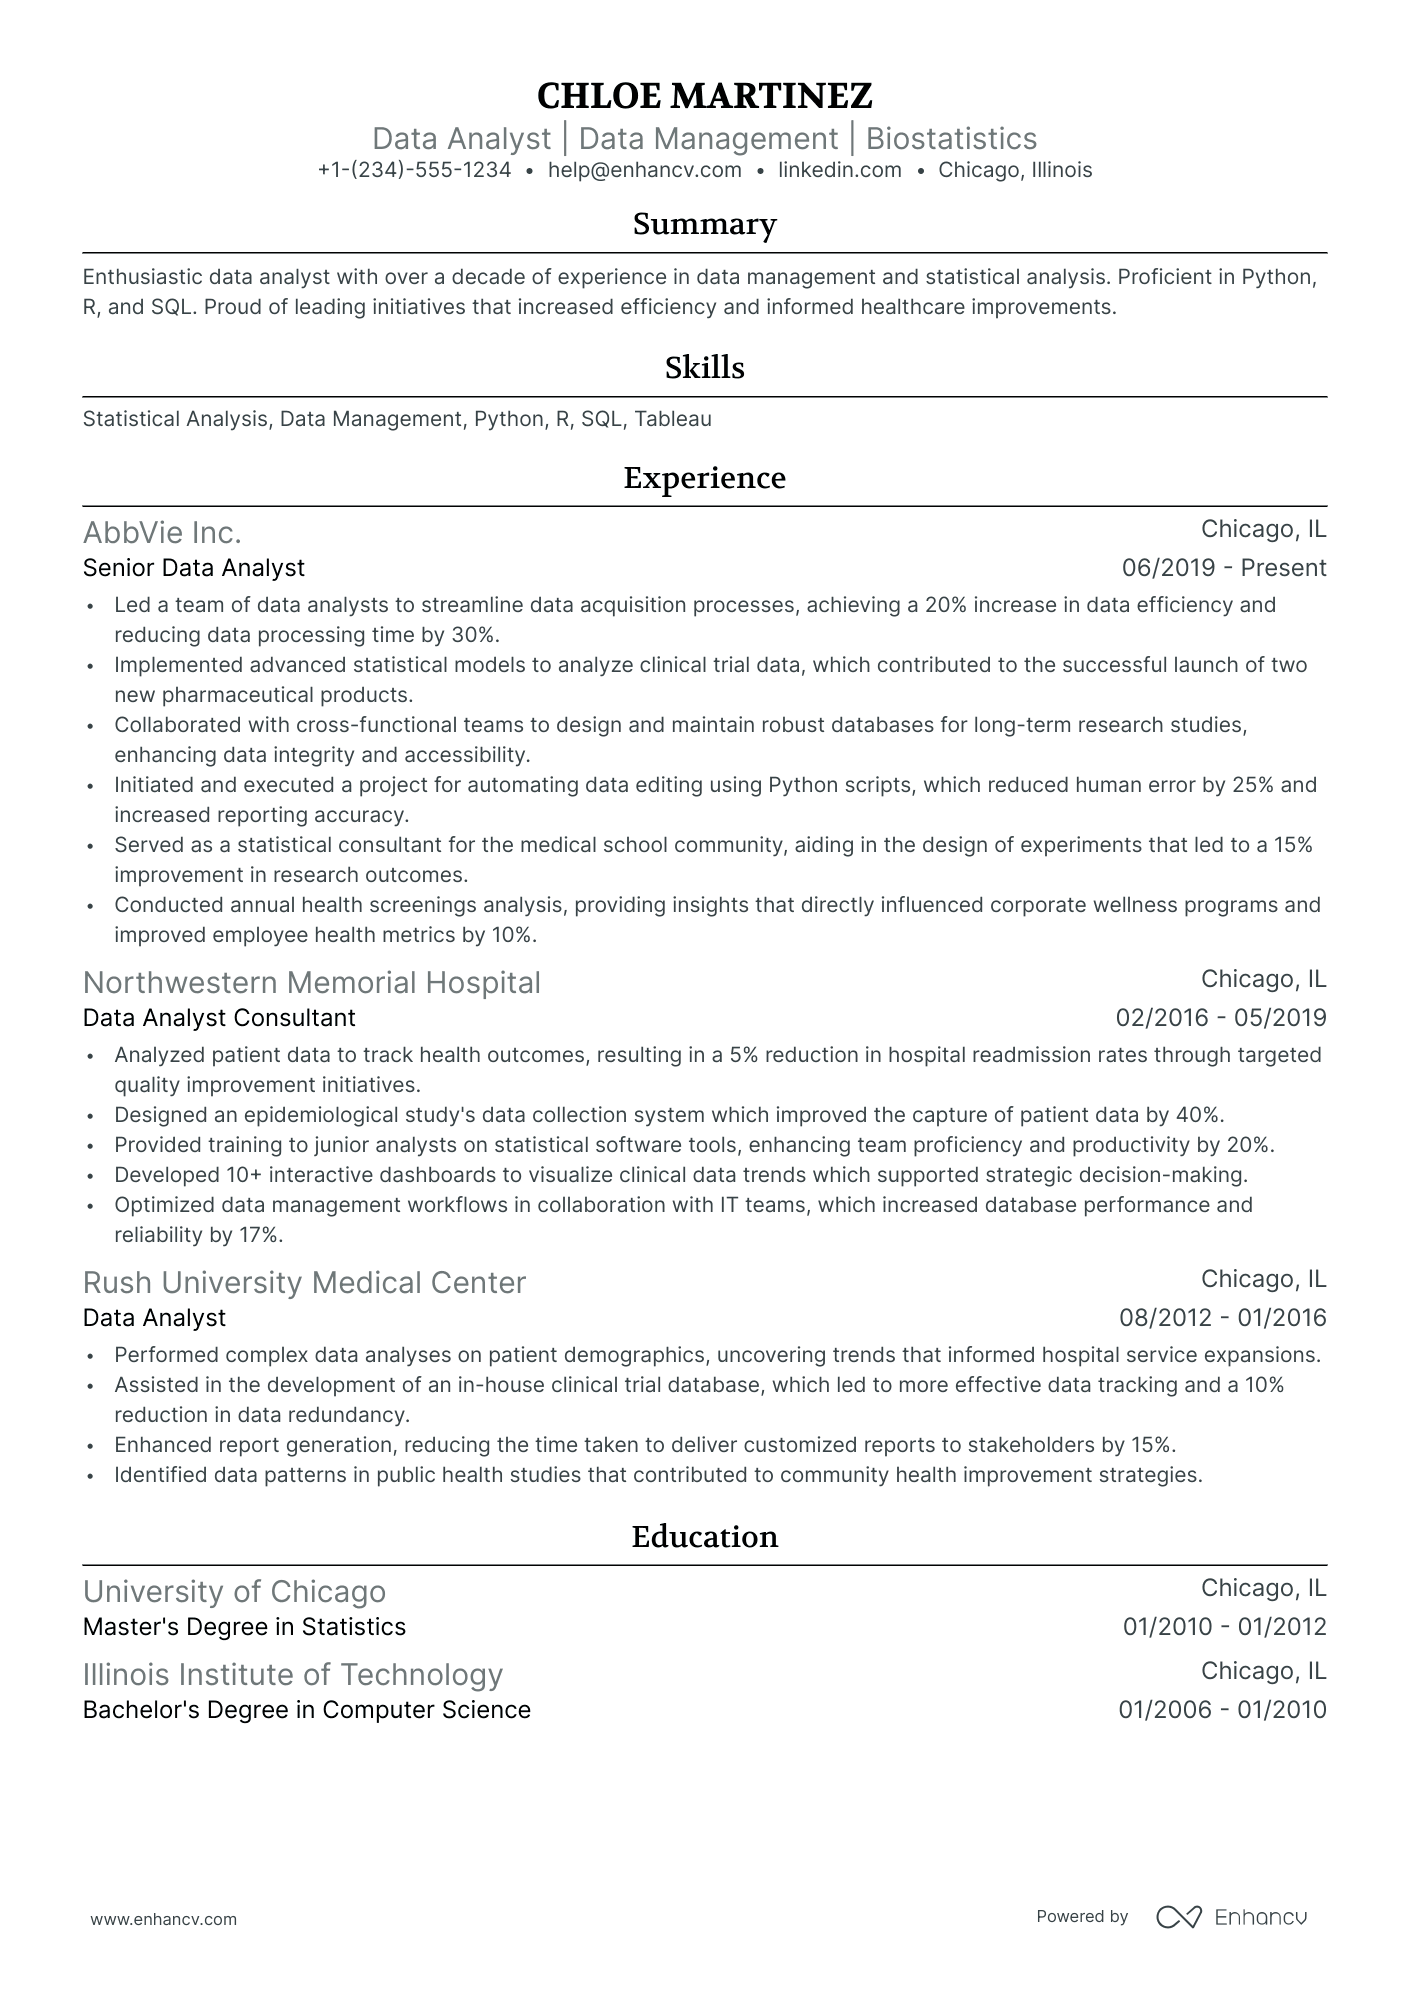
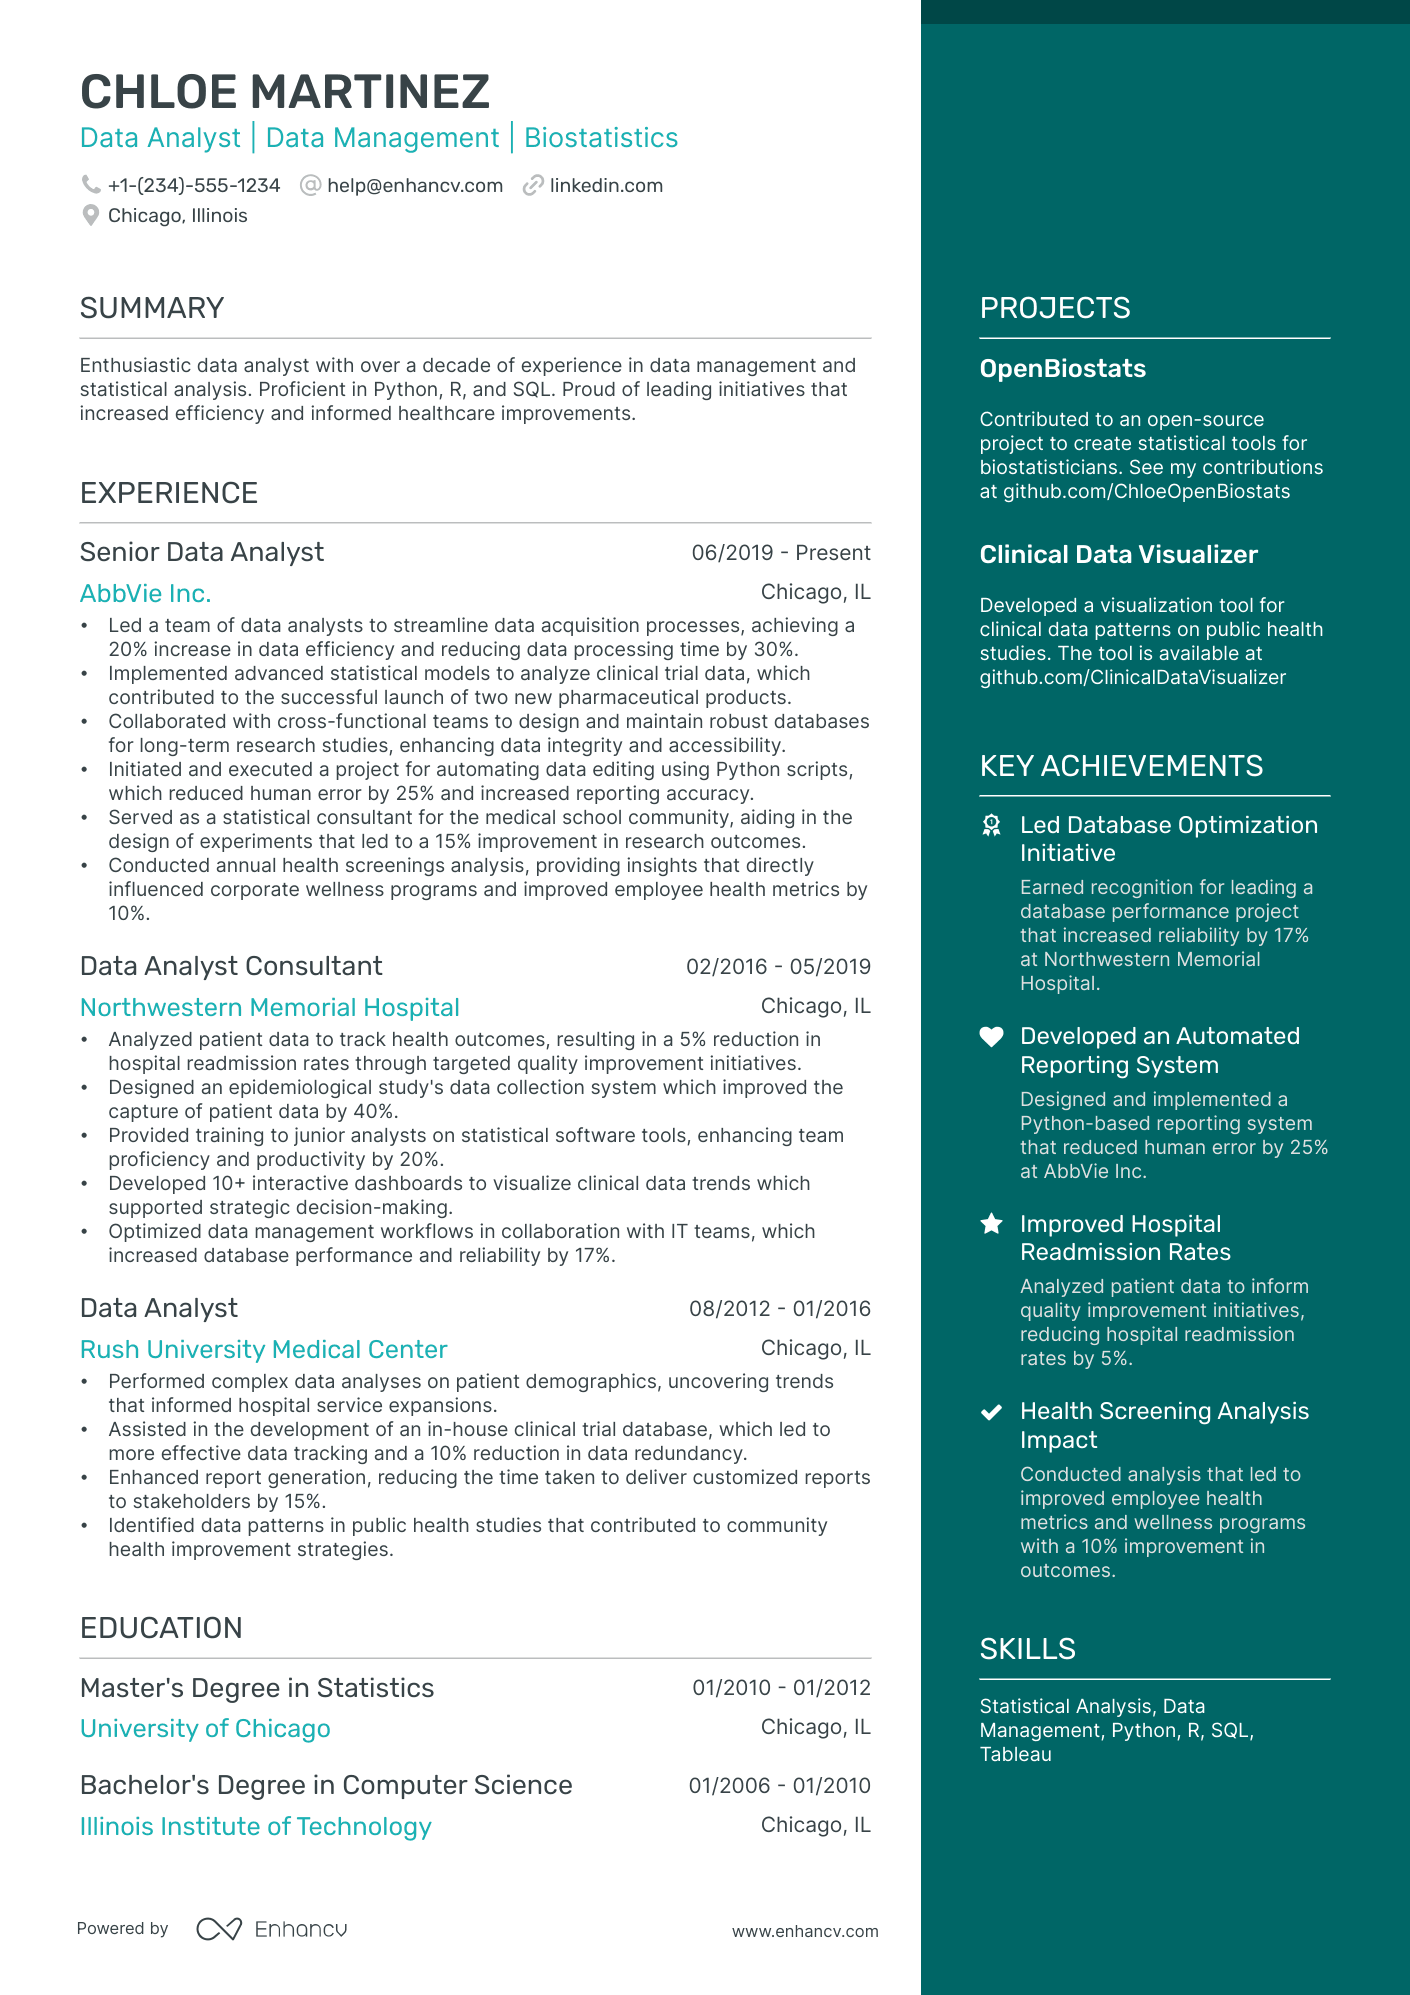
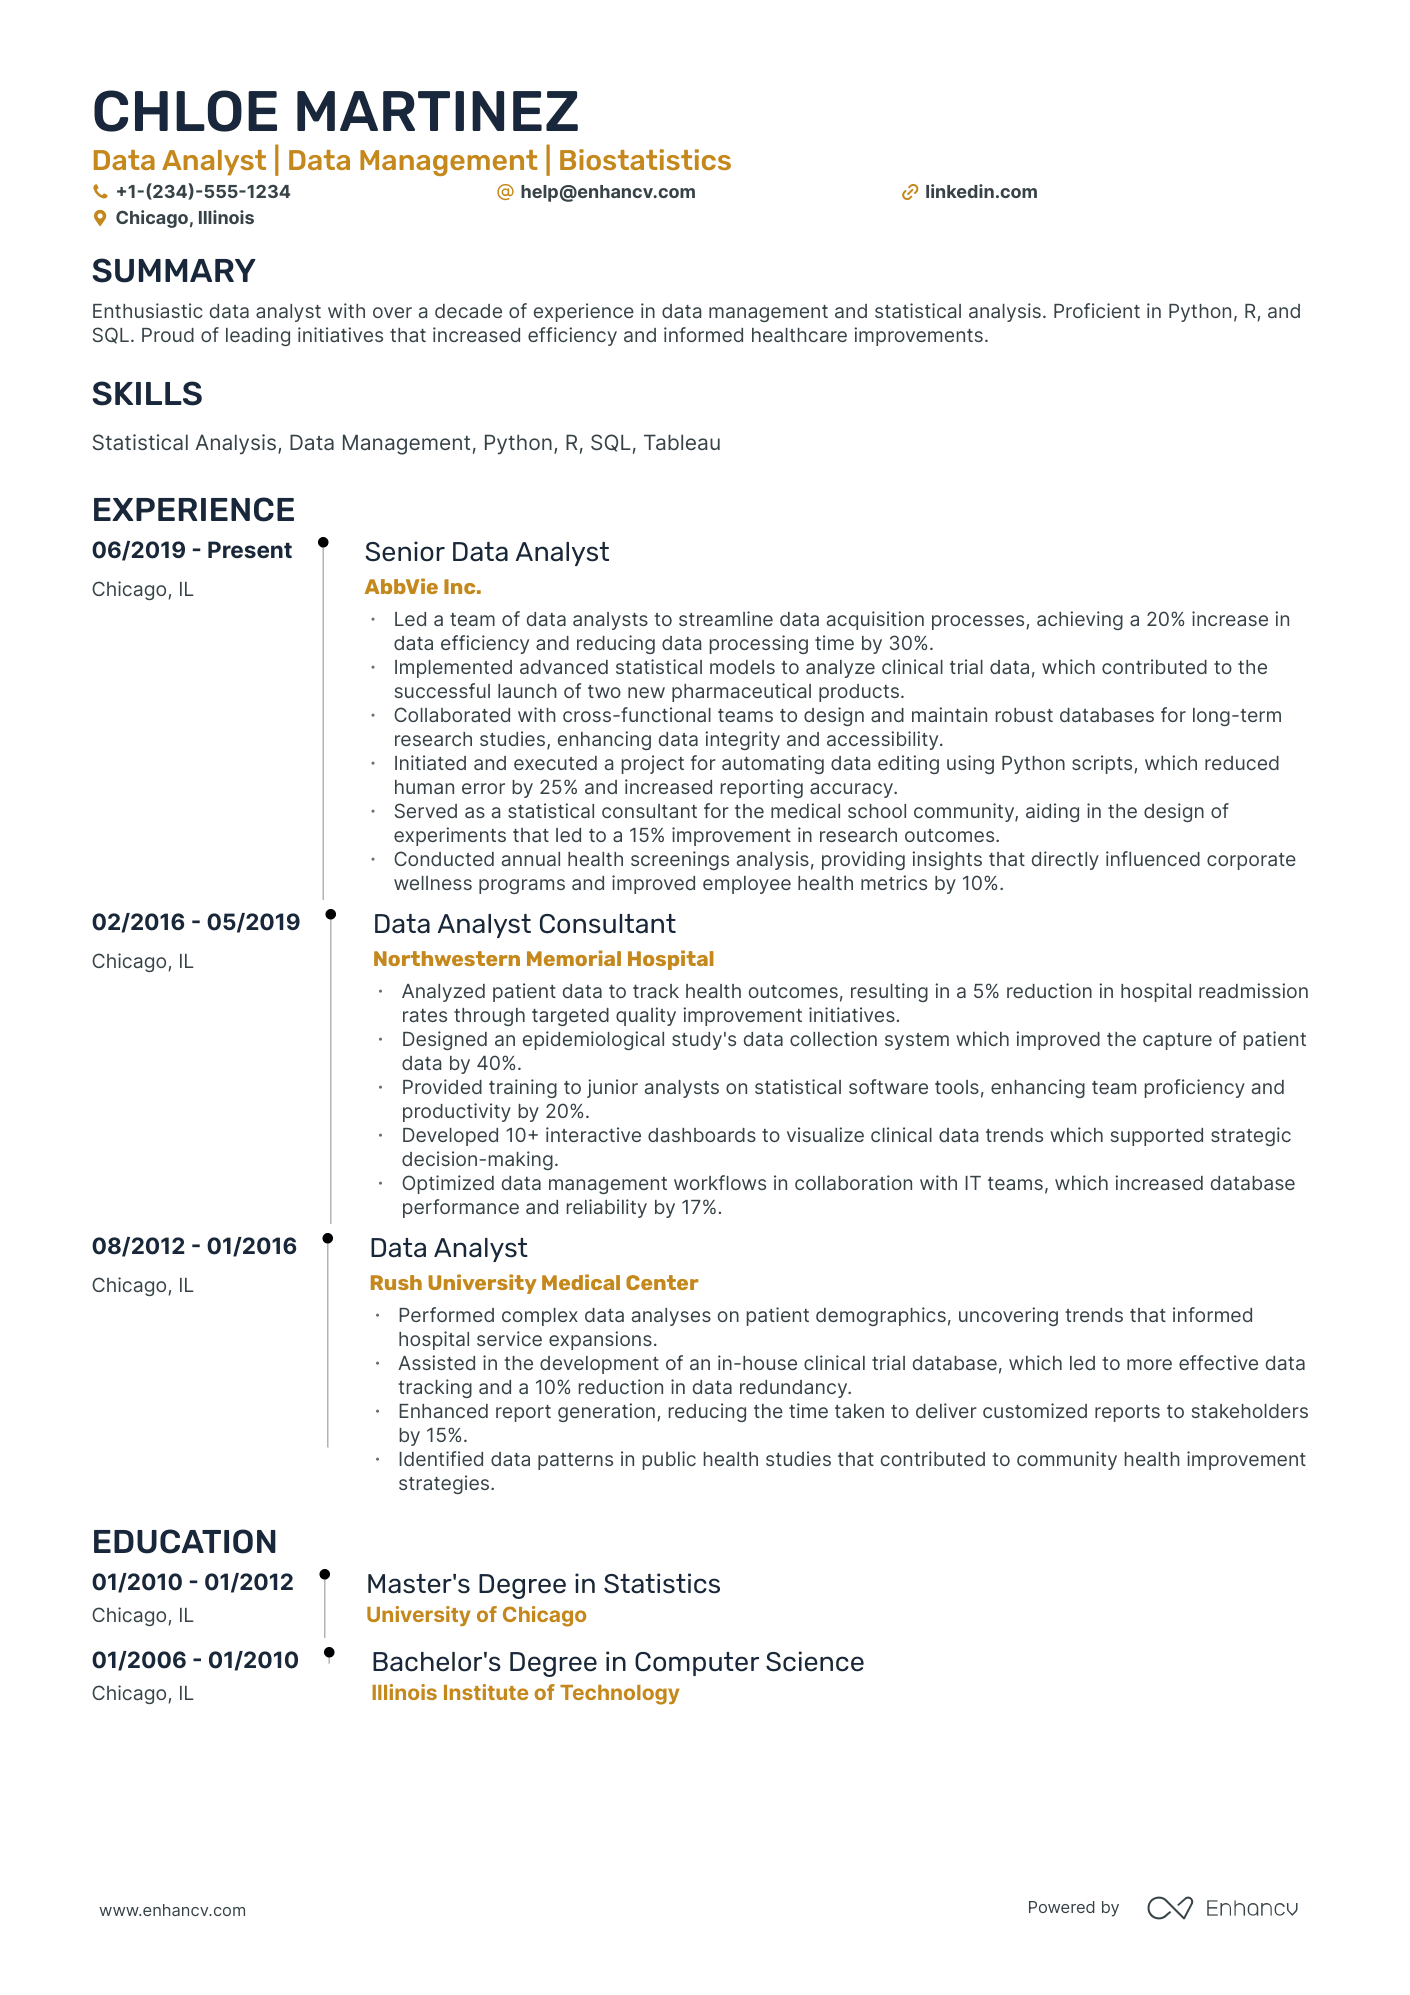
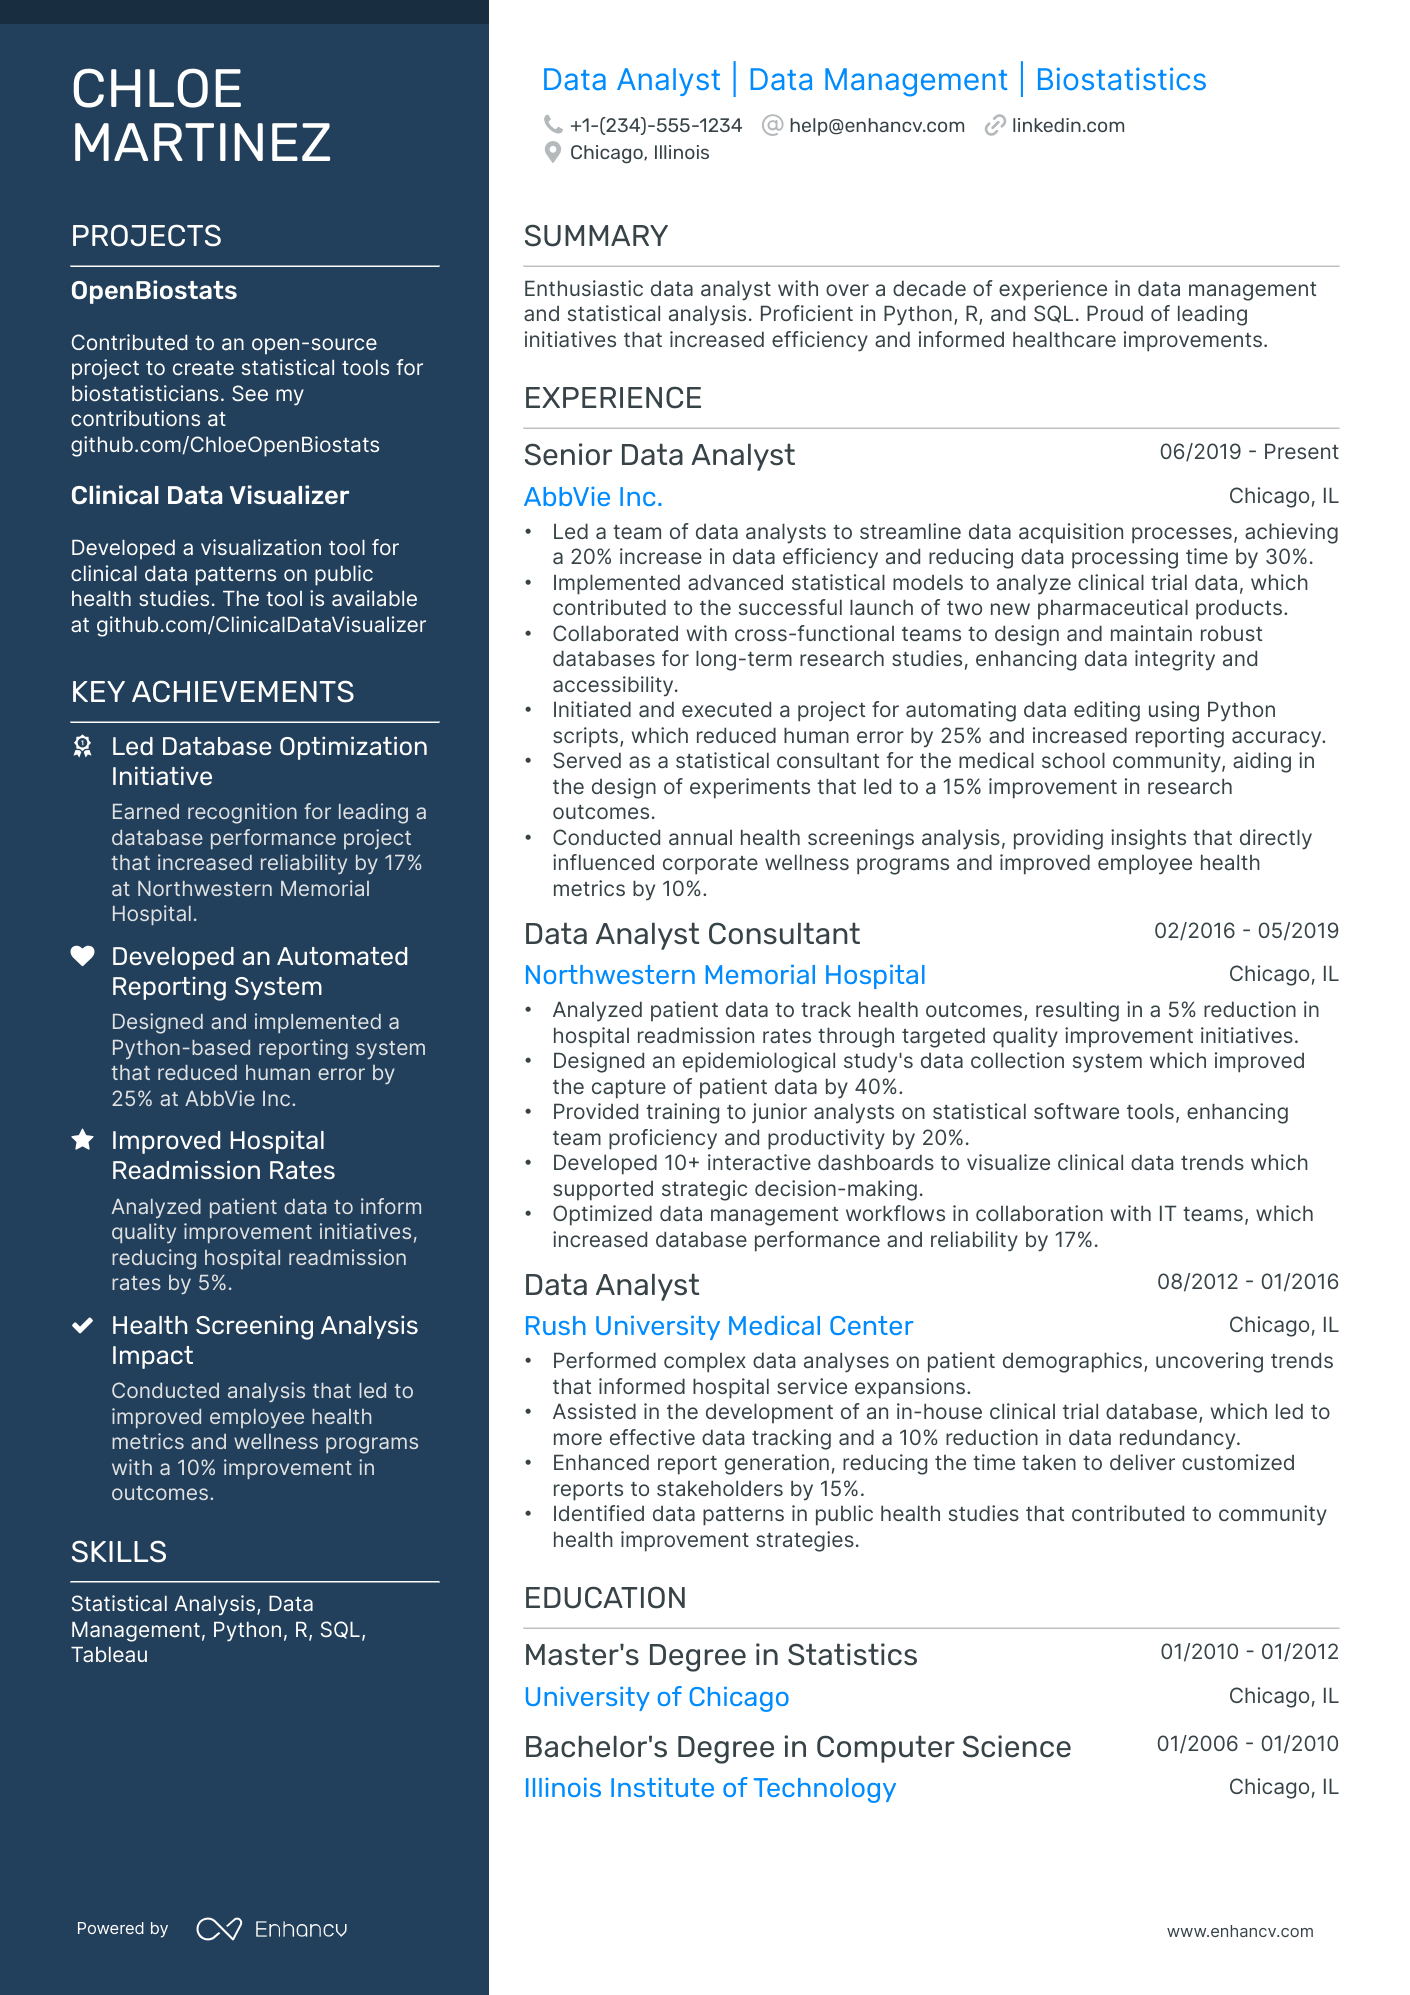
What recruiters are looking for is systematised content that is clear and coherent. Thus, your statistical data analyst resume needs to answer requirements and why you're the best candidate for the role from the get-go.
Often, a clear layout consists of:
- Sorting your experience in the reverse chronological order - starting with your most recent and relevant roles. This is an excellent choice for more experienced professionals;
- Writing your contact information (e.g. personal phone number and email address) and your portfolio or LinkedIn link in your statistical data analyst resume header. If you're wondering to include a photo or not, always make sure that it's appropriate for the country you're applying in;
- Use the basic, most important statistical data analyst resume sections - your experience, education, summary, etc. Use your resume's real estate wisely to tell a compelling, professional story and match job description's keywords;
- Don't go overboard with the length of your resume. One page is absolutely fine if you happen to have under a decade of relevant experience.
Are you still wondering if you should submit your statistical data analyst resume in PDF or Word format ? The PDF has a few more advantages, as it doesn't change the format and the text can't be altered upon application.
Format matters most when your statistical data analyst resume is assessed by the Applicant Tracker System (or the ATS).
The ATS parses resumes, looking for specific keywords, skills or experience that match the job description.
P.S. We recently did a study on how the ATS works and were able to demystify three of the biggest misconceptions about how it assesses candidate resumes.
To pass the ATS evaluation, select any of the serif or sans-serif fonts. Popular choices that would help your statistical data analyst resume stand out include Raleway, Exo 2, Montserrat, etc.
Most traditionalists go for Arial or Times New Roman, but it's often the case that many candidates choose these fonts, and you'd thus lose points on the uniqueness front.
Keep in mind the market you’re applying to – a Canadian resume, for instance, might have a unique layout.
Upload & Check Your Resume
Drop your resume here or choose a file. PDF & DOCX only. Max 2MB file size.
PRO TIP
If you failed to obtain one of the certificates, as listed in the requirements, but decide to include it on your resume, make sure to include a note somewhere that you have the "relevant training, but are planning to re-take the exams". Support this statement with the actual date you're planning to be re-examined. Always be honest on your resume.
Recruiters' preferred statistical data analyst resume sections:
- A header with relevant contact information and headline, listing your current job title
- A resume summary or objective pinpointing what is most impressive about your expertise (that aligns with the role)
- An experience section highlighting the specifics of your responsibilities and achievements
- A skills sidebar to intertwine job advert keywords with your unique talents
- An education and certifications sections to serve as further accreditation to your professional experience
What recruiters want to see on your resume:
- Proficiency in statistical analysis software and programming languages (e.g., R, Python, SAS, SPSS, STATA).
- Demonstrated experience with data cleaning, transformation, and visualization techniques.
- Knowledge of advanced statistical methods, such as regression analysis, hypothesis testing, factor analysis, and predictive modeling.
- A track record of data-driven decision making and the ability to translate complex statistical findings into actionable business insights.
- Experience with big data platforms and tools (e.g., Hadoop, Spark) and familiarity with database querying languages (e.g., SQL).
Adding your relevant experience to your statistical data analyst resume
If you're looking for a way to show recruiters that your expertise is credible, look no further than the resume experience section.
Your statistical data analyst resume experience can be best curated in a structured, bulleted list detailing the particulars of your career:
- Always integrate metrics of success - what did you actually achieve in the role?
- Scan the statistical data analyst advert for your dream role in search of keywords in the job requirements - feature those all through your past/current experience;
- Dedicate a bullet (or two) to spotlight your technical capabilities and how you're able to use the particular software/technology in your day-to-day roles;
- Write simple by including your responsibility, a job advert keyword or skill, and a tangible outcome of your success;
- Use the experience section to also define the unique value of working with you in the form of soft skills, relevant feedback, and the company culture you best thrive in.
Industry leaders always ensure that their resume experience section offers an enticing glimpse at their expertise, while telling a career narrative. Explore these sample statistical data analyst resumes on how to best create your resume experience section.
- Designed and implemented a complex data analysis system for analyzing massive datasets, which increased data processing speed by 30%.
- Led a cross-functional team in a large-scale predictive modeling project to identify market trends, achieving a 15% improvement in forecasting accuracy.
- Developed a suite of automated reporting tools for continuous tracking of key performance indicators, contributing to a 10% reduction in decision-making time for the executive team.
- Streamlined data collection procedures, reducing data redundancy by 25% and ensuring higher integrity in statistical analysis.
- Provided in-depth statistical analytics support for a market segmentation project that directly influenced a realignment of the company's marketing strategy.
- Coordinated with IT department to maintain statistical software and database systems, ensuring a 99% uptime and minimal disruption to ongoing analysis tasks.
- Utilized advanced statistical methods to analyze customer behavior, leading to the development of a new customer retention program that decreased churn by 20%.
- Collaborated with the product development team to integrate statistical analysis into new product design, resulting in a 10% increase in user satisfaction ratings.
- Initiated a project to cleanse and standardize legacy data, enabling more accurate historical analysis and supporting long-term strategic planning efforts.
- Implemented a new statistical model for analyzing financial risk which was adopted company-wide and reduced unexpected financial losses by 18%.
- Conducted extensive A/B testing to optimize user interface designs, which directly contributed to a 25% increase in conversion rates for the company's main product.
- Managed the transition to a new data warehousing solution, which resulted in a 40% reduction in data retrieval times for the analytics team.
- Played a key role in the development and launch of a machine learning-driven recommendation engine that lifted sales by 22%.
- Performed custom statistical analyses on demographic data which informed a targeted advertising campaign, leading to a 35% increase in market share within the core demographic.
- Mentored junior analysts, improving the overall team's statistical competency and reducing time to insight by an average of 2 weeks per project.
- Developed a statistical modeling framework that was instrumental in identifying cost-saving opportunities, culminating in a $1.5 million reduction in operational expenses.
- Spearheaded a data quality initiative that increased the reliability of the company’s internal reports by 40%, boosting stakeholder confidence in data-driven decisions.
- Enabled more precise targeting for marketing campaigns through the use of cluster analysis, resulting in an average 20% higher customer engagement rate.
- Orchestrated the statistical analysis of sales and operational data to uncover inefficiencies in the supply chain, leading to a strategic overhaul that saved the company $2 million annually.
- Partnered with senior leadership to create data visualizations and dashboards that distilled complex statistical findings into actionable insights for business decision-makers.
- Championed the adoption of advanced statistical techniques such as time series forecasting to enhance the precision of inventory management, yielding a 15% decrease in overstock incidents.
- Crafted and executed statistical models for customer segmentation that supported tailored marketing campaigns, increasing customer lifetime value by 28%.
- Led the evaluation of a new data aggregation platform, contributing to the enhancement of data analysis capabilities and supporting a more robust data-driven culture within the organization.
- Analyzed user interaction data to provide recommendations for product improvements, which were pivotal in achieving a user growth rate of 30% year-on-year.
The following content includes information from "O*NET OnLine" by the U.S. Department of Labor, Employment and Training Administration (USDOL/ETA). Used under the CC BY 4.0 license. The data represents the top responsibilities present on the task lists for statistical data analyst professionals.
Top Responsibilities for Statistical Data Analyst:
- Analyze and interpret statistical data to identify significant differences in relationships among sources of information.
- Evaluate the statistical methods and procedures used to obtain data to ensure validity, applicability, efficiency, and accuracy.
- Report results of statistical analyses, including information in the form of graphs, charts, and tables.
- Determine whether statistical methods are appropriate, based on user needs or research questions of interest.
- Prepare data for processing by organizing information, checking for inaccuracies, and adjusting and weighting the raw data.
- Develop and test experimental designs, sampling techniques, and analytical methods.
- Identify relationships and trends in data, as well as any factors that could affect the results of research.
- Present statistical and nonstatistical results, using charts, bullets, and graphs, in meetings or conferences to audiences such as clients, peers, and students.
- Design research projects that apply valid scientific techniques, and use information obtained from baselines or historical data to structure uncompromised and efficient analyses.
- Adapt statistical methods to solve specific problems in many fields, such as economics, biology, and engineering.
Quantifying impact on your resume
- List the specific statistical software and tools you are proficient in to demonstrate your technical capabilities.
- Quantify the size of datasets you have worked with to show your experience with large-scale data analysis.
- Highlight any improvements in efficiency or accuracy that you achieved in your analysis, using percentages or times saved.
- Include the number of reports or dashboards you've created to demonstrate productivity and output capacity.
- Mention any statistically significant results or findings in past projects to showcase your ability to derive meaningful insights.
- Indicate the number of data cleaning or manipulation techniques you know to show your data preparation skills.
- Refer to the number of cross-functional teams you've collaborated with to highlight your teamwork and communication skills.
- Detail the amount of revenue influenced or costs reduced through your data analysis to illustrate the economic impact of your work.
Action verbs for your statistical data analyst resume
Four quick steps for candidates with no resume experience
Those with less or no relevant experience could also make a good impression on recruiters by:
- Taking the time to actually understand what matters most to the role and featuring this within key sections of their resume
- Investing resume space into defining what makes them a valuable candidate with transferrable skills and personality
- Using the resume objective to showcase their personal vision for growth within the company
- Heavily featuring their technical alignment with relevant certifications, education, and skills.
Remember that your resume is about aligning your profile to that of the ideal candidate.
The more prominently you can demonstrate how you answer job requirements, the more likely you'd be called in for an interview.
Recommended reads:
PRO TIP
Mention specific courses or projects that are pertinent to the job you're applying for.
Balancing hard and soft skills in your statistical data analyst resume
Recruiters indeed pay close attention to the specific hard and soft skills candidates possess. Hard skills refer to technical abilities or your proficiency in technologies, while soft skills are the personal attributes and qualities developed over your lifetime.
If you're unsure about effectively quantifying these skills on your resume, follow our step-by-step guide. It's crucial to first understand the key job requirements for the role. Doing so enables you to accurately list your:
- Hard skills in sections like skills, education, and certifications. Your technical expertise is straightforward to quantify. Most organizations find it sufficient to mention the certificates you've earned, along with your proficiency level.
- Soft skills within your experience, achievements, strengths, etc. Defining interpersonal communication traits in your resume can be challenging. Focus on showcasing the accomplishments you've achieved through these skills.
Remember, when tailoring your statistical data analyst resume, ensure that the skills you list match exactly with those in the job requirements. For instance, if the job listing specifies "Microsoft Word," include this exact term rather than just "Word" or "MSO."
Top skills for your statistical data analyst resume:
R
Python
SQL
Excel
Tableau
SAS
SPSS
Power BI
Statistical Analysis Software
Data Visualization Tools
Analytical Thinking
Problem-Solving
Attention to Detail
Communication
Team Collaboration
Time Management
Critical Thinking
Adaptability
Creativity
Interpersonal Skills
Next, you will find information on the top technologies for statistical data analyst professonals from "O*NET OnLine" by the U.S. Department of Labor, Employment and Training Administration (USDOL/ETA). Used under the CC BY 4.0 license.
Top technologies for Statistical Data Analyst’s resume:
- IBM SPSS Statistics
- The MathWorks MATLAB
- Microsoft PowerPoint
- C++
- R
PRO TIP
The more trusted the organization you've attained your certificate (or degree) from, the more credible your skill set would be.
Your academic background: should you include your education and certifications on your statistical data analyst resume?
Adding relevant education and certifications to your statistical data analyst resume is beneficial, whether you're an experienced candidate or just starting in the field.
Featuring your higher education degree that aligns with the role demonstrates your commitment to the industry. On your statistical data analyst resume, include the start and graduation dates, followed by the name of the institution that awarded your degree.
Regarding certifications, it's wise to list those most relevant to the role or that have contributed to your array of crucial technical or personal traits. Be sure to include the name of the certificate and the awarding institution.
If uncertain about which certifications to feature prominently on your statistical data analyst resume, refer to our compiled list of the most in-demand ones for guidance.
The top 5 certifications for your statistical data analyst resume:
- Certified Analytics Professional (CAP) - INFORMS
- Certificate in Quantitative Finance (CQF) - CQF Institute
- Certified Data Analyst (CDA) - Data Science Council of America (DASCA)
- Certified Business Intelligence Professional (CBIP) - Transforming Data With Intelligence (TDWI)
- Associate Certified Analytics Professional (aCAP) - INFORMS
The content below includes information from "O*NET OnLine" by the U.S. Department of Labor, Employment and Training Administration (USDOL/ETA). Used under the CC BY 4.0 license. The data represents the top associations for statistical data analyst professionals.
Top US associations for a Statistical Data Analyst professional
- American Statistical Association
- American Academy of Actuaries
- American Educational Research Association
- American Mathematical Society
- American Society of Human Genetics
PRO TIP
Highlight any significant extracurricular activities that demonstrate valuable skills or leadership.
Recommended reads:
Best practices to your statistical data analyst resume summary or objective
To start, how do you know if you should include a resume summary or a resume objective ?
- Resume summaries are ideal for statistical data analyst professionals with more experience, who'd like to give a quick glimpse of their biggest career achievements in the top one-third of their resumes.
- On the other hand, resume objectives serve as a road map for recruiters. Candidates use the objective to show how their experience aligns with the statistical data analyst role they're applying for while showcasing the North Star of their career (or where they want to be as a professional in the next couple of years).
The resume summary or resume objective could be the perfect fit for your statistical data analyst resume. The function of both is to highlight your professionalism succinctly. So, keep your writing specific: include no more than four sentences and target your application to the role. Here's how these specific resume sections help the statistical data analyst candidates stand out.
Resume summaries for a statistical data analyst job
- With over 7 years of extensive experience in statistical data analysis within the healthcare sector, adept at SAS, R, and Python programming for complex data manipulation. Instrumental in reducing costs by 15% through the development of predictive models for patient outcomes at MedTech Solutions.
- Dynamic financial analyst with a passion for statistical modeling and 5 years of experience in leveraging data to drive business solutions. Excelled at utilizing SQL and Excel to inform data-driven strategies that increased revenue by 20% in two consecutive quarters at FinanceCorp.
- Dedicated biologist aiming to pivot to a data-driven career path with strong foundational knowledge in statistical methods and data interpretation. Exceptional at applying critical thinking from scientific research to analyze large datasets, eager to bridge the gap between theoretical and applied data analysis.
- A former marketing manager with a proven track record of results-driven campaigns seeking to leverage analytical skills in statistics. Committed to mastering statistical software tools and techniques to contribute meaningfully to data-driven decision-making processes in a new industry.
- Seeking an entry-level opportunity to apply my strong quantitative background and enthusiasm for data analytics. Eager to develop hands-on experience with statistical software and techniques to inform high-stakes business decisions.
- As a recent graduate with a Bachelor's in Mathematics, I am looking to embark on a career in data analysis. My academic success is founded upon a profound interest in statistics, zeal for learning new programming languages, and drive to provide meaningful analytical insights.
Optimize your resume summary and objective for ATS
Drop your resume here or choose a file.
PDF & DOCX only. Max 2MB file size.
Average salary info by state in the US for statistical data analyst professionals
Local salary info for Statistical Data Analyst.” Source: My Next Move, National Center for O*NET Development. Accessed 10/15/2024
| State | Average Salary (in USD) |
|---|---|
| US National Average | $104,110 |
| California (CA) | $125,860 |
| Texas (TX) | $95,600 |
| Florida (FL) | $82,060 |
| New York (NY) | $118,950 |
| Pennsylvania (PA) | $83,560 |
| Illinois (IL) | $114,180 |
| Ohio (OH) | $88,170 |
| Georgia (GA) | $107,480 |
| North Carolina (NC) | $109,950 |
| Michigan (MI) | $106,390 |
Other statistical data analyst resume sections to support your expertise and skills
Recruiters are always on the lookout for that statistical data analyst candidate who brings about even more value to the role.
This can be either via their personality or additional accreditations they have across the industry.
Add to your resume any of the four sections that fit your profile:
- Projects for your most impressive, cutting-edge work;
- Awards or recognitions that matter the most;
- Publications further building up your professional portfolio and accreditations;
- Hobbies and interests to feature the literature you read, how you spend your time outside of work, and other personality traits you deem may help you stand out .
Key takeaways
- Impactful statistical data analyst resumes have an easy-to-read format that tells your career narrative with highlights;
- Select a resume summary or objective, depending on what sort of impression you'd like to leave and if your accomplishments are relevant to the job;
- If you don't happen to have much industry expertise, curate additional gigs you've had, like contracts and internships, to answer how your experience aligns with the statistical data analyst job;
- Be specific about the hard and soft skills you list on your resume to define your niche expertise and outcomes of using those particular skills;
- Always tailor your resume for each statistical data analyst application to ensure you meet all job requirements.
